The Guardian Datablog
The first systematic effort to incorporate publicly available data sources into news reporting.
What is it?
Making the numbers make sense – according to Simon Rogers, this is what data journalism is all about. When he launched the Datablog in 2009, it was intended to be a small blog offering the full datasets behind news stories in The Guardian newspaper.
It now comprises an entire news section highlighting data driven stories, searchable databases, data visualizations, and tools for exploring data. Journalists at Datablog use Google spreadsheets to share the full data behind their work, visualize and analyze that data, and provide stories for the newspaper and the website.
The Guardian has integrated data into their news production process in an approach that distinguishes them from many other newspapers. Through the Datablog, the Guardian provides access to the raw statistics behind the news and makes it exportable in whatever form the user desires.
How does it work?
Big data enables journalists both to tell stories they could not tell before, and to tell these stories more effectively . Technology enables access to large amounts of information, much of it published by government agencies.
According to Datablog's founder Simon Rogers, data journalism can be anything really. "It can be these enormous kind of data analysis projects. Sometimes it can just be finding the data. It's the stuff we all learned at journalism college, that is about finding information."
"These are the key numbers. 'What do you think?'"
Information is not a mess of numbers. Traditionally, journalists who were afraid of maths would avoid raw data. As Rogers observes, "Our job can just be revealing that data and saying: 'These are the key numbers. What do you think?'"
Datablog makes it easy for everyone - Guardian journalists, other reporters and the public at large - to navigate through large datasets. Access to this information makes it possible to generate different types of stories.
Depending on the characteristics of a particular story, Datablog journalists produce a comprehensive article for print, a video news item, or a set of data visualization for the web.
Why did they make it?
Datablog aims to make it easier for people to understand data. It enables journalists to analyze open data sources, pick out the most essential stories, and break them down for their audience.
Datablog aims to create opportunities for crowdsourcing research and citizen journalism. For example, the site posted data about British politicians’ travel expense claims, then asked the public to help them match what a politician was doing on that day with their corresponding expense claim.
The Guardian's related "Free Our Data" campaign has pushed the British government to review its access to information policies. Examples of citizen journalism on Datablog measure up to a high standard of quality journalism that integrates data into the news production process.
Why did we select it?
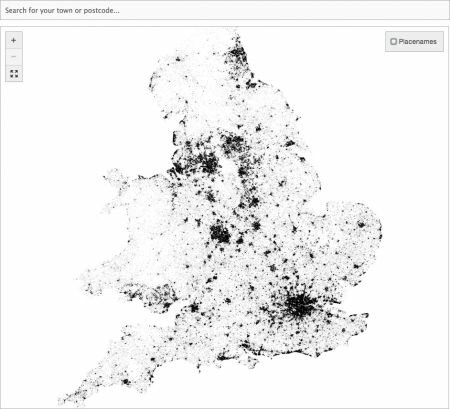
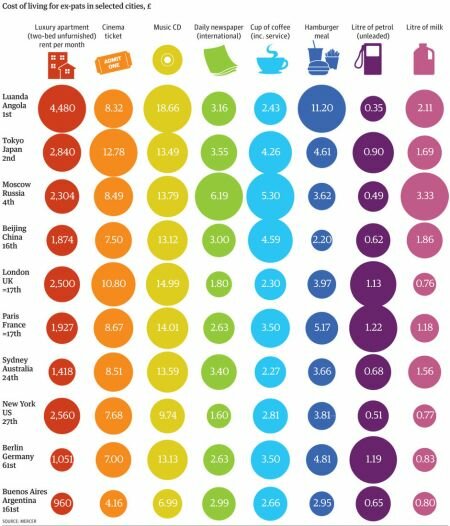
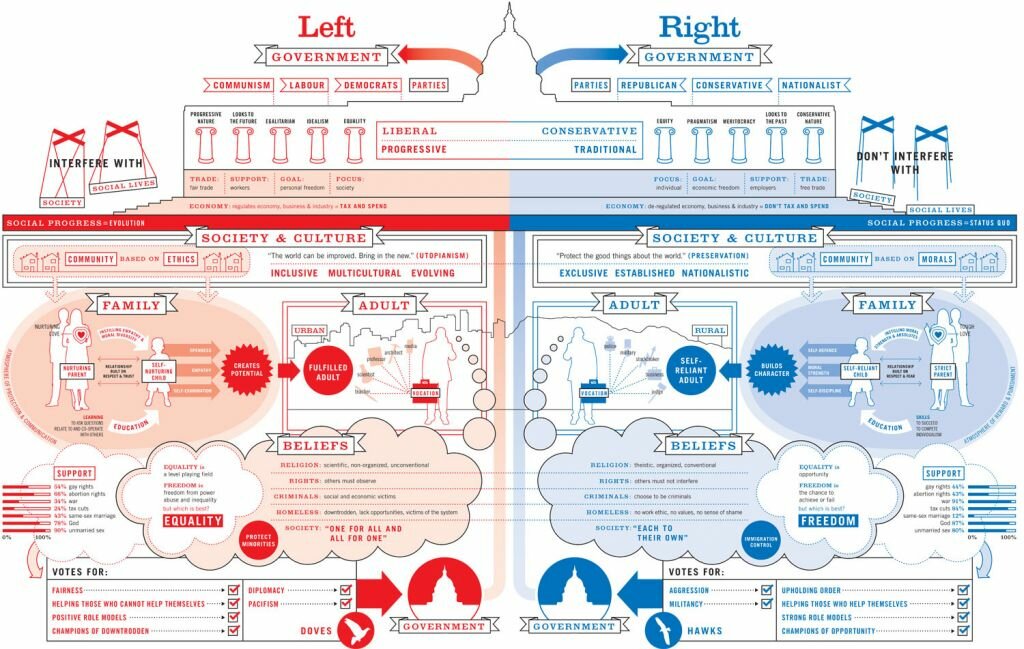
Datablog is excellent at data visualization. Among the first news organizations worldwide to integrate data into news production process, The Guardian is by far the most innovative pioneer in data visualization, interactive mapping and crowdsourcing. This has led to a number of essential stories, such as those about the war in Iraq.
Compare
The website visual.ly is a platform that connects designers, journalists, animators and developers with clients, featuring cloud-based collaboration tools. They are capable of delivering high-quality content quickly and on a large scale.
The platform also has a blog about data visualization. Data journalists and PhD-students in subjects such as Computer Science Visualization publish news about developments in the field.
Another comparable platform is helpmeviz.com, which helps people understand data visualizations. Its creators designed the site to facilitate discussion, debate and collaboration from the data visualization community. Finally, there is also Gapminder for a facted-based world view.