Million Dollar Blocks

A spatial information design project that looks at rarely accessible criminal justice data in new ways by using mapping software.

Director Laura Kurgan explains the project L. Kurgan

What is it?

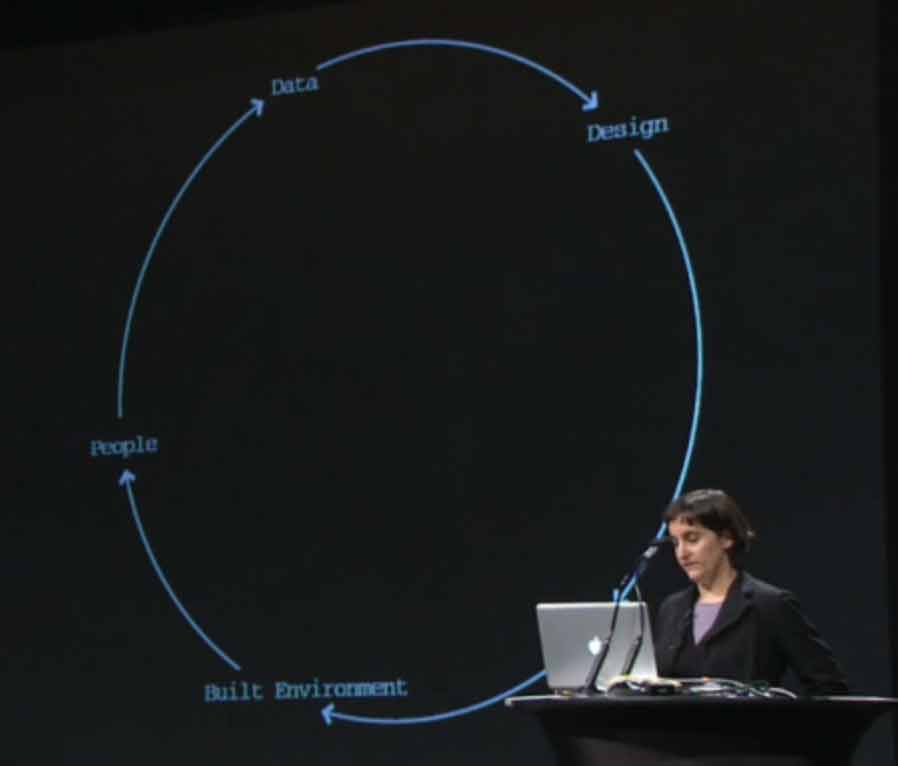
Million Dollar Blocks refers to an information visualization project about the US penitentiary system designed by the Spatial Information Design Lab (SIDL) in collaboration with the Justice Mapping Center (JMC).

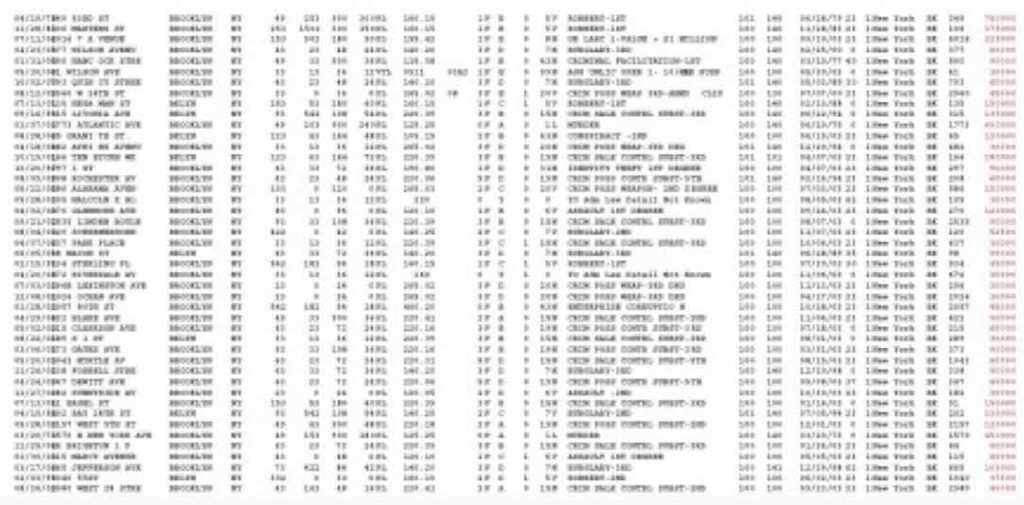
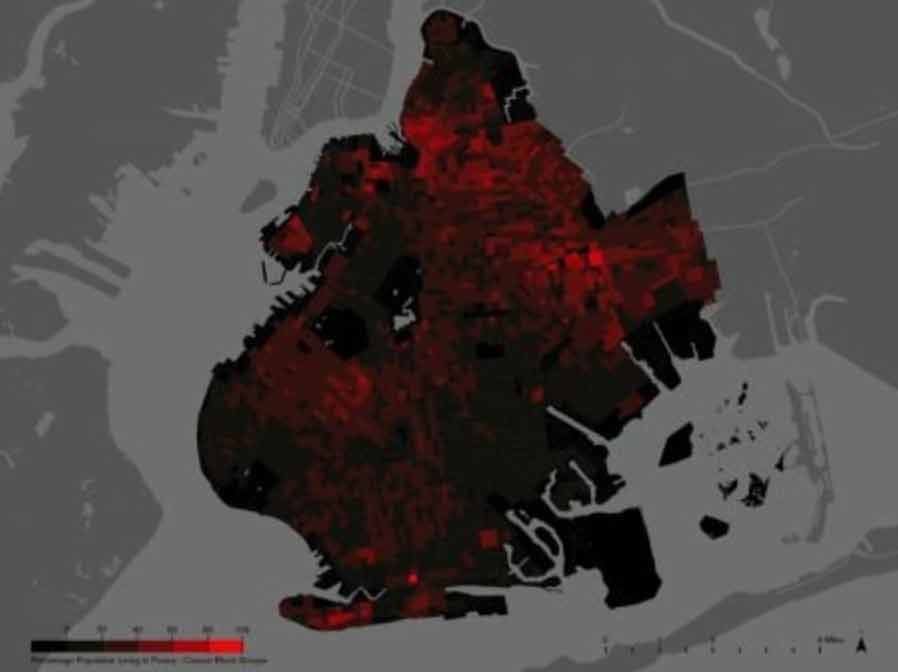
In many urban neighbourhoods across the US, the incarceration rates are so high that the state government spends over a million dollars per year to imprison residents of a single city block. Using primary source data of the criminal justice system, SIDL has created a set of geographical maps and info-graphics related to these so-called "Million Dollar Blocks". 

This architecture and urban design project intersects with digital forms of investigative journalism because it uses the spatial research methods and visualization tools of mapping software to open up and critically investigate information of interest to the general public and policy makers.

Excerpt from database: scrambled

How does it work?

It investigates criminal justice data by using location-based visual analysis and geo-mapping. Criminal justice data generally includes standard information such as name and home address of the convicted criminal, time and location of the crime, and length of the sentence.

Feedback loop of information resources

Traditional geo-maps based on this type of data generally focus on which crimes were committed, when, and where, in order to calculate crime rates in specific areas. The SIDL's mapping project, however, refocuses the same datasets to the people who are incarcerated (where do they report that they live? where are they locked up?), and relates this information to the incarceration costs of the inmates, inhabitants of what turns out to be "million dollar blocks", and often where they will return home after their sentence. 

This different use of the data produces new information about imprisonment patterns, which can help devise strategies for reducing the high costs and investing in the neighborhood rather than in the criminal justice infrastructure outside of the city itself.

Which tools and software are used?

SIDL employs the research methods and visualization tools of mapping software, which structures location-based data and transforms it into visual maps (cluster maps, density maps, hot-spots maps, etc.) and related infographics. 

Prison expenditures by block, 2003

As Laura Kurgan (SIDL) explains the use of GIS or geographic information systems: "By reorganizing tabular data using unique digital visualization techniques, and locating it geographically, the design lab tries to correlate disparate items of information and picture the patterns and networks they create."

For Million Dollar Blocks, the lab designed a set of geo-maps linking criminal justice data to social and economic data, as exemplified by crime and prison maps such as "Prison Expenditures by Census Blocks" or "Crime Density Maps in relation to Poverty Maps".

Why did they make it?

The makers of Million Dollar Blocks want to raise public awareness around the US incarceration system and its underlying policies.

The map-based data visualizations on imprisonment patterns show a vicious circle: large numbers of incarcerated individuals come from the same neighbourhoods; on return to that neighbourhood after being released from prison, many are frequently reincarcerated.

Percentage population living in poverty

The geographical portrayal of social and criminal justice data also renders the relationship between crime, poverty and race visible.

The investigative journalism approach of the project poses questions about how public money is spent. How do communities benefit from the large sums of money spent on prisons and jails? Might the funds be better spent on education, housing, and health care in these Million Dollar Blocks neighborhoods?

New Orleans neighbourhood

What is the impact?

The project invites public debate about issues related to public spending on incarceration in the US, and encourages policy makers to rethink and improve public institutions and urban infrastructures in terms of effectiveness and costs. 

​"New ways to think about crime and punishment"

As the SIDL reports: "Prison-spending maps have begun to influence the dynamics of the political debate, suggesting new ways to think about crime and punishment, recidivism and reform."

State and city officials have used the maps for community investment strategies and programs focused on re-entry and personal development. Million Dollar Blocks will be further developed and refined with feedback from state and local leaders.

Why did we select it?

It shows the power of information visualization tools, specifically mapping software, for journalistic practices. 

​There is a "politics of code" that determines what is visible and what remains hidden

The project shows how spatial information visualizations can shed new light on the criminal justice system and influence policy making. Data maps and graphs create different stories than print or video journalism and offer an alternative perspective.

Percentage persons of color

The project also explores the ethics and politics of digital data mapping. The basic premise of the SIDL is that data are not neutral, but always collected, structured, and processed for a specific goal: there is a "politics of code" that determines what is visible and what remains hidden.

Looking afresh at incarceration data through the geography of the city with mapping software leads to unique results that urge nothing less than political and social reform.

Compare

See also the case on data from The Guardian.

Another similar case is the Justice Atlas of Sentencing and Corrections of the Justice Mapping Center, a corrections data driven, interactive mapping tool. Designed to contribute to our knowledge of the place-based dimension of incarceration, reentry and community supervision in states around the USA.

 
Comments