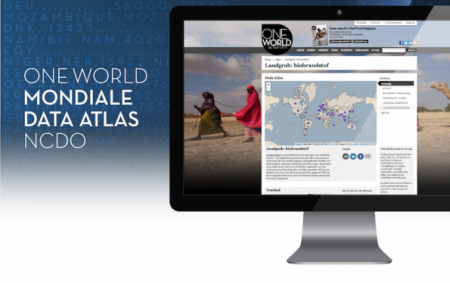
Data Atlas
Online world maps visualizing existing data sets about major global development issues. Both the original data sets and the visualizations may be used free of charge.
What is it?
The OneWorld Data Atlas is an online tool exploring global development issues through maps and infographics based on data sets provided by the UN and other international organizations.
Charting a changing world, the Atlas includes data visualizations on issues such as food security, natural resources, and population growth. The maps and charts can be easily embedded on other websites and raw data sets may be downloaded free of charge.
How does it work?
Many institutions working on development issues are starting to share their data. The World Bank, the World Food Programme and other UN departments, NGOs, and some Ministries of Foreign Affairs, for instance, have recently opened their databases to enrich public knowledge and enhance the transparency of their work. Together, these free data sets contain a wealth of information on how the world is changing.
However, most data are not immediately comprehensible for the general public. The Data Atlas editors find, analyse, and review online data sets and make them accessible and meaningful for a general audience (in Dutch). The Data Atlas editors also clean up data sets and store them in CKAN, an open source data management system that enables easy sharing.
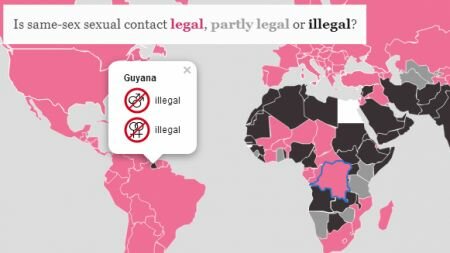
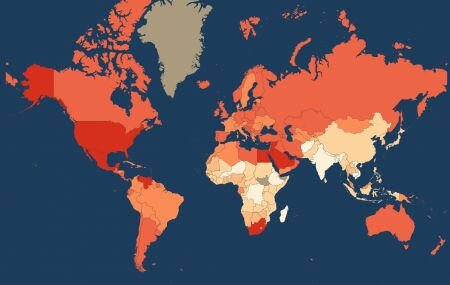
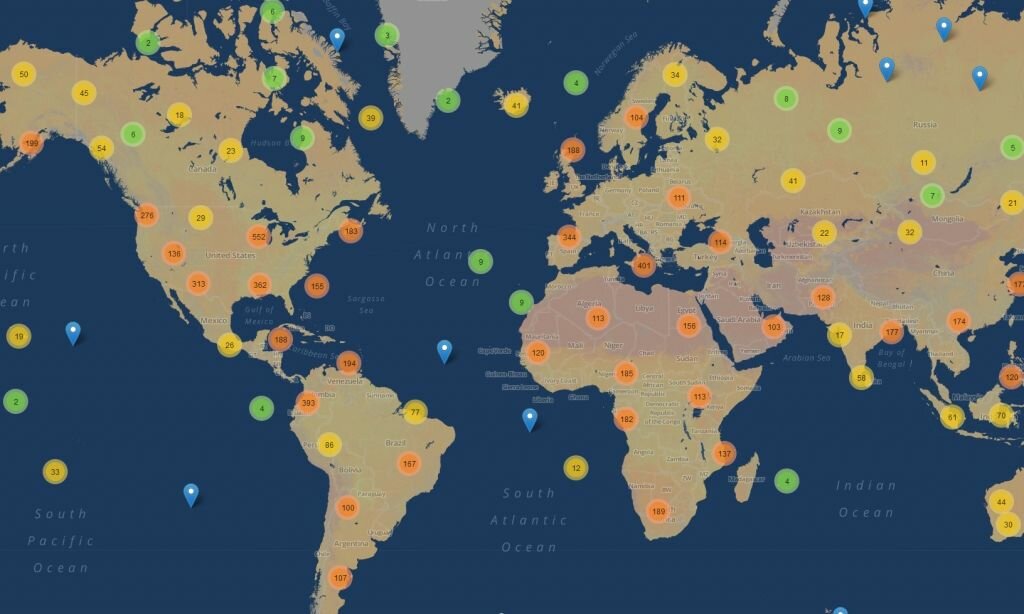
Through Drupal software, different kinds of maps (e.g. choroplete, heatmap, moving maps, bubbles) and charts (eg. histograms, bar charts, line charts) can be made to show the data in various ways. Users can click on timelines to see the world changing over time and compare different data.
Background
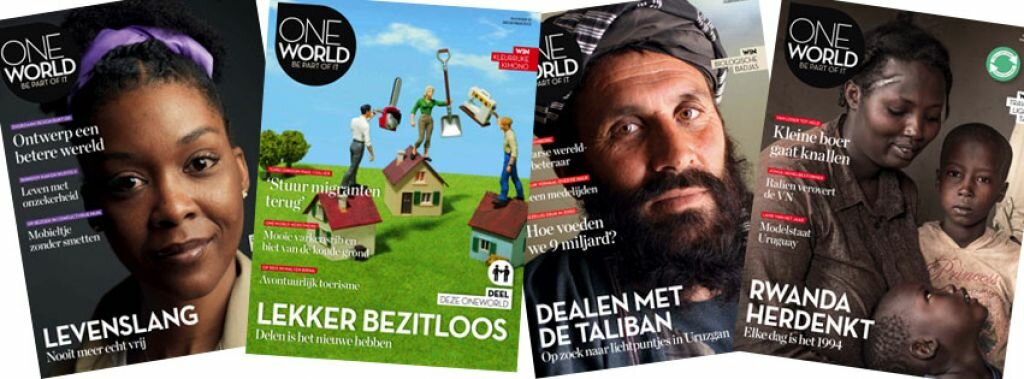
OneWorld is a journalism platform covering international development and sustainability for a Dutch audience (in Dutch). The Data Atlas is a tool developed by OneWorld to visualize data in various types of maps and charts in order to enrich more traditional blog stories. The Data Atlas allows readers to explore the raw facts behind stories.
Online readers may be moved by a news story or photo, but through the Data Atlas, they can check the statistical context of a story to better understand its importance. OneWorld plans to make the Data Atlas available for international use in the future.
Who are the users?
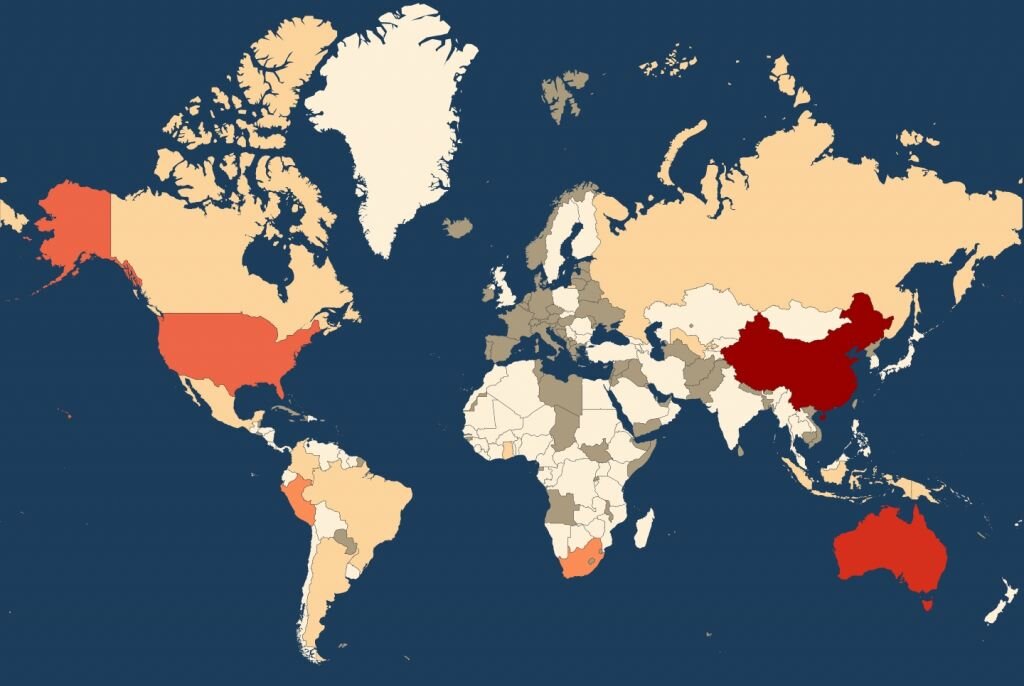
The OneWorld Data Atlas has been developed for a broad range of users. News blog readers may use the Data Atlas to understand the news in context and further explore topics of interest. Each theme is highlighted from several different angles, for example, under "food security" there are data about hunger, obesity, meat consumption, and land grabbing. Users can click through timelines of the maps to see how the world has changed over time, but they can also compare data from different countries in a bar chart, read background information, or pull up related articles.
Professional journalists and NGO-employees are using the Atlas to provide better information, for example by embedding maps on their own websites to enrich their own stories. Schools and universities also use the stats, maps and figures in the Data Atlas, because the data are offered in an accessible way. Some have incorporated the Data Atlas in their curriculum. Finally, the Data Atlas is of interest for data journalists, designers and developers, who prefer to use the data sources that the maps are built on and design their own visuals. They also reconstruct analyses and findings to double-check the findings.
In this way, the Atlas is constantly improved through the efforts of the data community. In 2015, a tool will be added to the Data Atlas for organizations wishing to produce quantitative maps on global issues in their own (corporate) identity.
Why did we select it?
By making quantitative facts and figures available as context for news, analysis and anecdotes, the Data Atlas contributes to a more objective and fact-based information flow, especially as concerns the developing world. Furthermore, with the Data Atlas, OneWorld adds to openness and transparency in the development sector.
The often polemic debate on spending taxpayers’ money on development aid is too rarely backed by facts. The Data Atlas makes huge amounts of data readily available and comprehensible, thus contributing to the quality of this debate. Although the tool is currently only available in Dutch, OneWorld is planning to make it available in English and possibly other world languages in the future.
Compare
-World Bank Data Viz: A Tumblr blog by the World Bank that collects visualizations about the fight against poverty.
-Gapminder.org: A widely used resource initiated by statistics professor Hans Rosling that visualizes the most important global trends.