Mapping Arms Data
An interactive data visualization that tracks arms and ammunition flows in order to understand the global arms trade and inform public debate and policy interventions.
What is it?
Drawing from existing data sources, the project tracks the global trade in small arms, light weapons, and ammunition. Small arms are responsible for the vast majority of conflict deaths and homicidal violence across the globe yet the trade is poorly regulated and penetrated by illicit networks.
The MAD project increases transparency and promotes accountability in the global trade of small arms and ammunition in order to understand how they threaten security and development throughout the world.
How does it work?
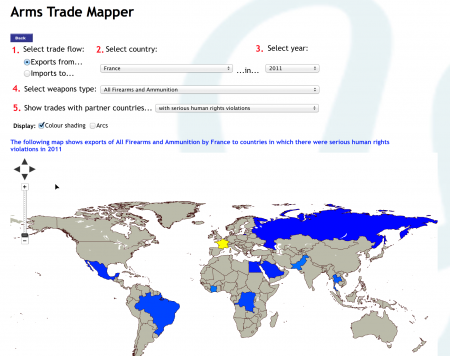
The underlying data draws from over 37 publicly available sources documenting the authorized trade of arms and ammunition, covering 262 states and territories and aggregating over a million data points. Users can explore the interface to map weapons flows by country and year between 1992-2012.


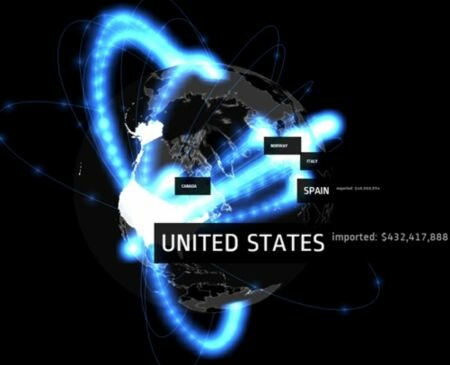
The visualization displays the volume and composition of each country’s small arms transfers, differentiating between military and civilian weapons and ammunition. It also shows the direction of exports and imports and how much they are worth.
The opaque nature of much of the global small arms trade makes tracking these flows immensely difficult. MAD’s reliance on publicly available data makes it an imperfect guide to assessing the totality of the arms trade since much of it takes place in the shadows.
However, it represents the best effort by far to aggregate and visualize this data. One sees, for instance, a spike in the flow of Iranian arms exports to Sudan as fighting erupted in Darfur after 2003, or the huge inflow of arms and ammunition imports that followed Mexico’s declaration of a war on drugs in 2006.

Why did they make it?
Virtually all firearms begin their lives legally, but many are diverted into the illicit trade, fuelling organized crime and insurgency across the globe. The small arms market is remarkably opaque, poorly regulated, and linked to murky networks of armed groups. The absence of transparency, accountability and regulation is particularly shocking given the extraordinary human costs of gun violence.

The MAD visualization shines a light on the $8.5 billion market in small arms and ammunition. It assembles specialized research carried out by governments and think tanks to inform activists, journalists and the wider public in an engaging and graphic manner.
Indeed, the tool was used by diplomats during United Nations negotiations for an Arms Trade Treaty in 2012 and 2013. By increasing public scrutiny over authorized imports and exports, the Igarapé Institute and PRIO hope to curb the unregulated proliferation of small arms and light weapons.
Why did we select it?
It is a pioneering effort to inform debate about the flow of small arms and ammunition, a topic that is often hidden from view. It has sparked global media coverage that helped people grasp the scale of the problem - and the involvement of their own governments in the arms trade.
The MAD visualization has been viewed by over 4 million people and was the recipient of several international awards and nominations. It shows how technology can render huge amounts of publicly available information comprehensible in ways that shape debate and journalistic coverage with implications for global security and development.
Other projects
The Igarapé Institute has several other projects that employ technology in innovative ways to promote security and development, including:
- The Child Security Index, a smartphone app that allows Brazilian children and care-givers to map perceptions of everyday violence in their communities.
- The Citizen Security Database allows users to interact with trends in public security and safety interventions and explore micro-level data about individual projects across Latin America and the Caribbean.
- The Smart Policing initiative is an Android app that uses video, audio and GPS functions of phones to improve oversight over police in Brazil, Kenya and South Africa.
In 2014 and 2015 the MAD project is being upgraded. It will feature new data on arms and ammunition exports and imports. What is more, it will include a new filter that provides the average price for selected weapons per country. This will allow users to see how street prices for firearms vary from setting to setting. Such information is useful in predicting the demand for guns, and possibly future hot spots around the world.